Solar Electric System
Gerd Muehllehner,
Introduction
In 2005/2006 we installed a single tracking photovoltaic system containing 16 panels described below. After about 1 ½ years of experience with the system we expanded by adding 4 more trackers. Both installations will be described below
1 Tracker
Technical Specifications
16 photovoltaic (PV) panels (Kyocera) 167 watts each 2,600 watts peak
Area each PV panel 51”*39” (width*height) Total 13*17 feet
Converter Aurora Magnetek
Contractor H&H Electric
Technical Performance
Typical for a sunny day in summer 22 kwatt-hrs
Typical for one month in summer 400-500 kwatt-hrs
In order to predict the amount of electricity generated by a system one must take into account the solar radiation as a function of location, fixed or tracking collectors and efficiency.
Solar radiation is tabulated for
various locations (e.g.
Given the fact that our location is facing a hill towards the South accounting for the reduction in output during the winter months, the agreement is surprising. During the last 12 month the panel generated 3950 kWh versus an expected 4376 kWh, which is within 10% of the actual.
On a sunny day in summer the panel quickly reaches a value close to the specified maximum 2200 watts (after expected 15% transmission and conversion losses). In the evening, haze tends to reduce the output. Below is a plot of the power output for one sunny day.
Financial Performance
Cost of the system, completely installed $25,885.-
Cashback award from Focus on Energy (35%) $ 8,892.-
Federal Tax Credit $ 2,000.-
Final cost of system to us $14,993.-
Expected power generated per year, 4,000 kWh
Value of generated electricity using time-of-day meter
(both sold to Alliant and used directly by us) $520.00
Return on Investment at present electric rates 3%
Tax savings due to Production Tax credit (1.9 cent/kWh) $76
Tax savings due to depreciation (10 year straight line) $336
Annual return on investment after taxes 6.2%
Discussion
After some initial gathering of data, it was easy to estimate the technical performance. Dealing with H&H Electric was also a pleasure that made the installation painless. Their effort in solving small issues after the installation was outstanding.
One decision which has to be made is whether to use a
straight electric meter which runs backwards when the amount of electricity
generated is more than the amount of electricity used, or whether to use a
time-of-day meter. Here are some of the considerations: Using a regular meter
you get essentially $0.10 per kWh and pay the same amount for any excess
electricity used. Using a time-of-day meter you get $0.16 per kWh Monday-Friday
Dealing with Alliant Energy was a bit more of a problem since they had little experience with a solar system connection involving time-of-day metering. These problems are now resolved: we are paid the same rates for the electricity we generate as for the electricity we use, i.e. $0.18 during peak hours and $0.04 cents the rest of the time. Also, we do not pay a second customer charge for the second meter (after some clarification involving the Public Service Commission).
Another question for your tax advisor is whether you can depreciate the system, since you are now engaged in parallel power generation. You will have to pay income tax on the income from the power generation, but the depreciation will more than offset the income tax. The above numbers for the depreciation are based on a 30% tax bracket.
Emotionally, we love the idea that we will never have to pay another electric bill: The electric utility pays us instead. If the electric rate goes up, we will simple get more. Currently we get about $50.- every 2 months (more during the summer, less during the winter). I have included on the next page a copy of a utility bill, which shows that we used $17.27 worth of electricity, but generated $52.48. Obviously, the numbers will not look as favorable in December and January.
I expect that the solar PV system will increase the value of our house and therefore do not consider a payback period, since the payback will occur when we sell the house. As the cost of electricity increases, the value of the PV system to the next person to buy our house will also increase.


![]()
![]()
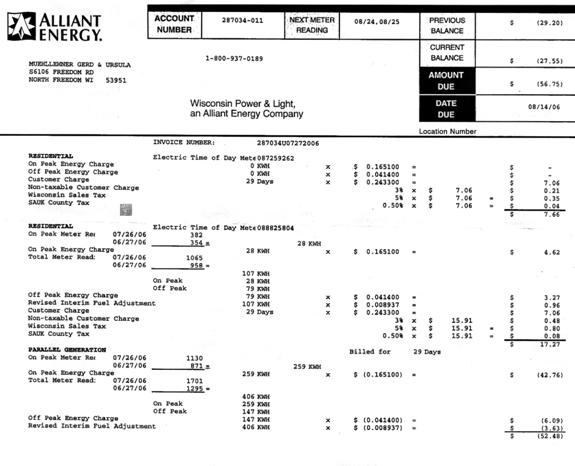
$17.27 charge for 107 kWh $52.48 credit for 406 kWh
Electricity used by us while the PV system is generating electricity does not show up on the bill either as a charge or a credit. We normally use 200-300 kWh per month without the PV system.
4 Trackers
As mentioned in the introduction, after successful operation of the 1 tracker installation, we have now (Summer 2007) decided to add 4 more trackers, essentially identical to the first system.
Technical Specifications
16 PV panels (Kyocera) 180 watts each * 4 trackers 11,520 watts peak
Area each PV panel 51”*39” (width*height) Total 13*17 feet
Converters Aurora Magnetek
Contractor H&H Electric
Financial Performance
Cost of the system, completely installed $105,000.-
Cashback award from Focus on Energy (25%) $ 26,250.-
Federal Tax Credit (installation spread over 2 years) $ 4,000.-
Final cost of system to us $ 74,750.-
Expected power generated per year, 16,800 kWh
Value of generated electricity using time-of-day meter $ 2,184.-
Return on Investment at present electric rates 2.9%
Tax savings due to Production Tax credit (1.9 cent/kWh) $304.-
Tax savings due to depreciation (10 year straight line) $1618.-
Annual return on investment after taxes 5.5%
Note that I have assumed that the expected power will be 16,800 kWh, i.e. 4200 kWh each. The new trackers are in a slightly better location than the first tracker accounting for the extra 5% in assumed output. The decreased return on investment is primarily a result of the reduction in the cashback award from 35% to 25% from Focus on Energy.
Discussion
My main goal was to not only make my personal contribution to reduction in CO2 emissions, but to test whether PV solar energy makes financial sense relative to other investments such as bonds. Only if it is financially reasonable will a larger group of citizens install solar power (assuming they have a good location and the financial means).
I believe that a return on investment of more than 5% after taxes is competitive with tax-free municipal bonds or typical highly rate commercial bonds. As time goes by, the electric rates will rise, increasing the return on investment. On the other hand, some repairs will have to be assumed. The output of the panels is certified to be not less than 90% after 20 years. A disadvantage is that the investment is not liquid; only when the house is sold will I recover most if not all of the original investment.
There are some discussions in the industry to raise the electric rates for distributed co-generation. WE energies and MP already pay more than 20 cents per kWh for solar generated power. This would clearly become a major incentive to install more solar PV systems.